
“We are not makers of history; we are made by history.” — Martin Luther King Jr.
India’s retail inflation dips to more than 8-year low, wholesale inflation softens
India’s retail inflation which is measured by the change in the Consumer Price Index (CPI), eased to 1.54% YoY in September from a two-month high of 2.07% in August. It is the lowest YoY inflation reading since June 2017. The inflation print dropped below the lower end of RBI’s tolerance range of 2%-6% for the second time in three months so far this fiscal year. The average inflation for H1FY26 stood at 2.20%, compared to 4.55% in H1FY25.
Food inflation, the largest component of the Consumer Price Index (CPI), decreased by 164 basis points to -2.28% in September from -0.64% in August, marking the fourth consecutive month in the negative territory. It is the lowest recorded food inflation since December 2018. The decline in retail inflation and food inflation can be attributed to slowdown in inflation of vegetables (-21.38%), pulses and products (-15.32%), spices (-3.07%), cereals and products (2.06%), meat and fish (2.15%), milk and products (2.51%) and eggs (2.76%).
Inflation is expected to undershoot the RBI’s downwardly revised projection of 2.6% for FY26 due to GST rationalisation, better supply conditions, and favorable monsoon for the rabi season.
Wholesale inflation moderated to 0.13% YoY in September from a 4-month high of 0.52% in August. This can be attributed to steep drop in prices of vegetables (~24% YoY) followed by decline in fuel prices. The average inflation for H1FY26 stood at 0.18%, significantly lower than H1FY25 (2.07%).
Inflation for manufactured products, the largest component in the WPI basket, eased to 2.33% YoY in September from 2.55% in August. The fuel and power segment recorded a deflation for the sixth consecutive month at 2.58% in September. Moreover, the deflation for primary articles segment moderated to 2.1% in September against 3.32% in August. A favourable base effect could push the WPI back in deflation in October.
Industrial output growth at 3-month low led by slowdown in mining & electricity
India’s industrial output, which is measured by the Index of Industrial Production (IIP), fell to a 3-month low of 4% YoY in September. The softer reading can be attributed to contraction in the mining sector and slowdown in electricity sector driven by heavy rainfall in some parts of the country. The mining sector growth declined to -0.4% YoY in September from 6.6% in August while the electricity sector output moderated to 3.1% YoY in September from 4.1% in the previous month.
In contrast, Manufacturing sector output, the largest in the IIP basket, rose to 4.8% YoY in September. Within the sector, 13 of 23 industry groups recorded improvements with notable growth basic metals (12.3%), electrical equipment (28.7%), and motor vehicles, trailers and semi-trailers (14.6%). The GST rate cuts and festive demand is likely to have a positive impact on the manufacturing output thereby driving the IIP growth in October.
As per the use-based classification, the top three contributors to IIP growth in September are Intermediate goods (5.3% in September vs. 5.2% in August) Infrastructure/construction goods (10.5% vs. 10.4%), and Consumer durables (10.5% vs. 3.5%). For H1FY26, IIP grew at 3.08%, considerably weaker than 4.1% in H1FY25.

Net GST revenue growth softens, GST rate cut impacts
The Centre’s gross GST revenue in October rose 4.6% YoY to INR 1.96 lakh crore, mainly driven by import-related collections (up 12.8%). However, net GST revenue, which is the difference between Gross GST on sales and Input Tax Credit (GST paid on purchases/expenses), grew at the slowest pace in FY26, by 0.6% YoY, as revised GST slabs led to postponement of supplies (although it reflects a partial impact of the GST rate rationalisation). The absolute net GST collections stood at INR 1.69 lakh crore, the third-highest monthly collection in FY26. Maharashtra, Karnataka, Gujarat, Tamil Nadu, and Haryana contributed more than 40% to gross GST revenue

Indian rainfall at 108% of LPA, Impacts kharif crops
The southwest monsoon in India ended the season (as of September 30) with a cumulative rainfall of 108% of long period average (LPA), which was almost similar to 2024 but affected key crop-growing regions across the country. The CRISIL Rainfall Distortion Index (RDI) laid out the facts clearly with their Rainfall Distortion Index (RDI), measuring the spatial spread and intensity of abnormal rains in kharif-growing areas. RDI reached 18.7 for the 2025 southwest monsoon season, which is the highest positive value in 14 years, depicting a major spatial skew, compared with 17.9 in 2024 and a 5-year average of 9.9. A higher positive index value indicates a greater geographical spread and quantum of excess rainfall.
As per CRISIL, 58% of India’s kharif-growing regions (Rajasthan, Punjab, Haryana, Telangana) experienced excess rainfall, which is significantly higher than 42% in 2024. Major affected crops include cotton and rice. However, the southwest monsoon trends bode well for rabi crops as they benefit from surplus moisture and highly rely on irrigation. Experts predict India could witness its third consecutive successful harvest if other factors work in favour of the rabi season.
Summary of Southwest Monsoon, 2025 (Region-wise & Month-wise)

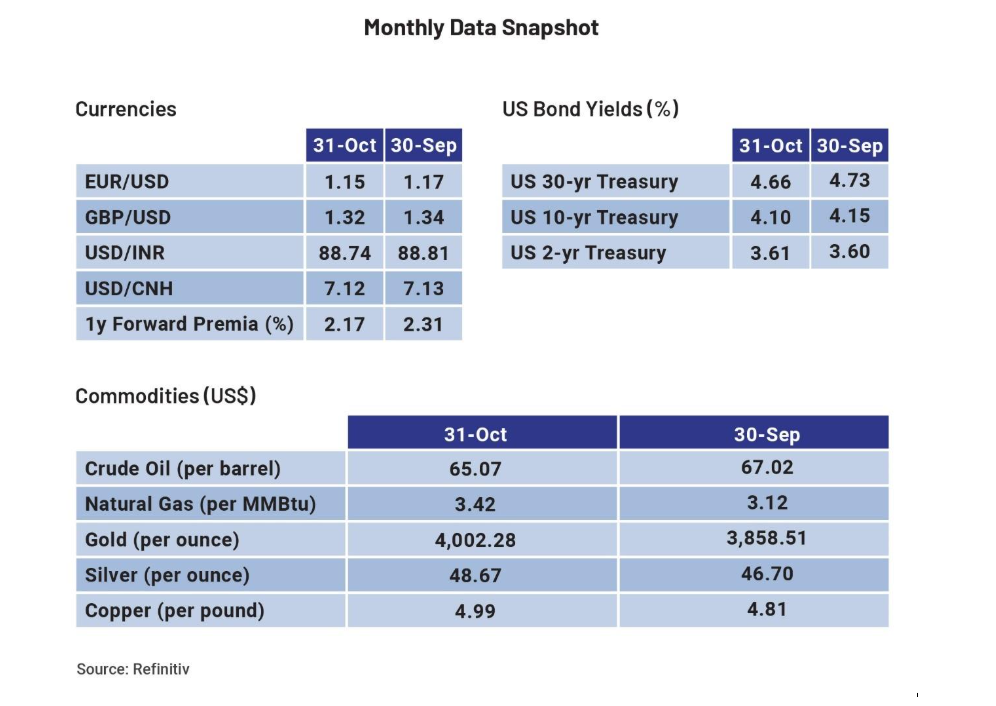
Crude oil prices – downside bias remains
Crude oil prices are continuously in a tussle between the end of a prolonged US government shutdown and concerns over global oversupply. This caused prices to remain nearly flat at the end of October ($65.07/bbl). Optimism brewed that the over 40-day-long US shutdown would bring back the investors’ risk appetite to the market. Ending the shutdown will result in the recovery of demand from the world’s largest oil consumer. Amid these developments, the Organization of the Petroleum Exporting Countries and its allies, or OPEC+, added to oversupply concerns by announcing an increase in oil supply, although modestly, by 137,000 barrels per day (bpd) for November and December. Notably, the oil cartel has hiked output by 2.7 million bpd since April but slowed the pace of output hikes in October and November. Moreover, US inventories continue to pile up. In the week ending October 31, crude inventories in the US surged 5.202 million barrels. Due to a modest global growth outlook, geopolitical tensions, and a rise in OPEC/non-OPEC output, the downside bias remains strong despite a few upticks due to factors such as a rise in Chinese imports, among others.


Disclaimer: The information provided in this article is for general informational purposes only and is not an investment, financial, legal or tax advice. While every effort has been made to ensure the accuracy and reliability of the content, the author or publisher does not guarantee the completeness, accuracy, or timeliness of the information. Readers are advised to verify any information before making decisions based on it. The opinions expressed are solely those of the author and do not necessarily reflect the views or opinions of any organization or entity mentioned.